Stakeholder coalitions
The network configuation shapes strategy options
Stakeholder network basics

In the Stakeholder 360, the network structure is the configuration of relationships among the stakeholder groups and organizations. When represented as a network graph, they become circles (nodes) with lines (ties) connecting them. Various socio-demographic attributes and network characteristics of the nodes can be represented by the size of the node, the colour, the shape, and the vertical position.
In the Stakeholder 360, opinion leaders are interviewed and asked about their working relationships with other stakeholders. All stakeholders interviewed or mentioned by interviewees are included in the network graph.
Some obviously have more influence than others. Sociological research has shown that those who are more well-connected in a network graph are more influential. In the Stakeholder 360, those with more influence are placed vertically higher on the graph.
Benefits of taking account of the network structure
The advantages of looking at the structure of the stakeholder network include:
The discovery of coalitions among stakeholders.
The matching of social licence levels and issue concerns with specific stakeholders and with coalitions.
The identification of the most influential opinion leaders, overall and in specific sectors or geographical locations.
Opportunities for converting existing supporters into opinion leaders by creating initiatives that make them more well-connected.
Opportunities for converting neutral or ambivalent stakeholders into supporters through initiatives that address concerns they share with supporters.
Opportunities for reducing the size of opposition coalitions by connecting some members to supporter coalitions that share common concerns.
An example of strategic network analysis
A Stakeholder 360 study was used to develop a community relations strategy for Minera San Cristóbal in southwestern Bolivia. In 2009 the S360 discovered that a coalition of groups was against the project. They were the cluster at the bottom right of the 2009 graph. They disapproved of the mine (note the red and orange colors) because the mining villages were prospering while villages further away were not. The scarcity of lines (i.e., working relationships) between the left and right sides of the 2009 graph revealed the mutual isolation of mining villages from non-mining agricultural villages.
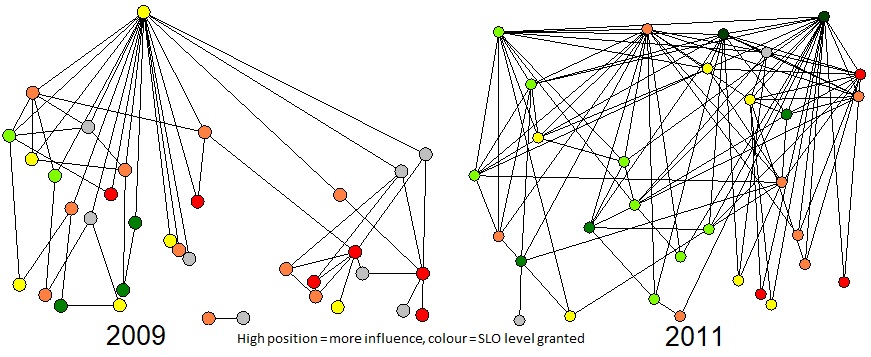
The company immediately launched a regional economic development initiative which brought the clusters together to develop a plan. Subsequently, the non-mining villages were able to take advantage of the boom in demand for quinoa. The 2011 S360 graph shows that many new working relationships were developed. Those who were previously the strongest opponents of the mine became its strongest supporters (green nodes).
Comparing internal and external networks
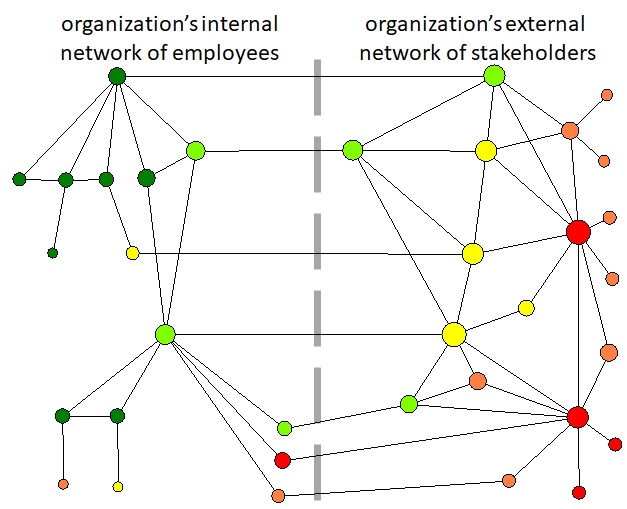
Similarity breeds friendship. It is a well proven finding in social psychology. When organization leaders look outwards at their stakeholders, they tend to form more and deeper relationships with those who view the organization’s activities as they do, that is, positively. Unfortunately, this can give organization leaders a false view of their stakeholder network.
The graph to the right shows just such a situation. The left side shows the network inside the organization and the right side shows the external stakeholder network. In this example, it is the people at the bottom of organization who have exposure to the negative narratives about the organization’s activities.
The Stakeholder 360 can be applied both inside and outside the organizational boundary. In this way, the management of the focal organization can develop a configuration of relationships that keeps them apprised of important external narratives and their associated risks.